Difference between revisions of "Providing the exact location of an avalanche or snowpack observation"
(→Step-by-step description) |
|||
| Line 62: | Line 62: | ||
|Avalanche observations with an exactly location are highlighted with [[File:LocationPin.png]] in the observation overview table. | |Avalanche observations with an exactly location are highlighted with [[File:LocationPin.png]] in the observation overview table. | ||
|} | |} | ||
| − | |||
| − | |||
==Related documents== | ==Related documents== | ||
Revision as of 13:55, 12 May 2015
| REQUIREMENTS | |
| Permission | All user levels |
| Connectivity | Online only |
This document describes how you can provide a precise location of an avalanche observation or a snowpack observation.
| NEW 2014/15 | In addition to dropping a pin to indicate the precise point location of an avalanche, users now also have the ability to draw an polygon to record the outline of an avalanche event. |
Background
In the InfoEx all assessments and observations need to have a geospatial reference. Subscribers need to maintain an up-to-date catalog of locations to allow the efficient and consistent georeferencing of their observations. Typical locations included in a location catalog are forecast areas, operating zones, roads, avalanche paths, ski runs or weather observation sites. See Location catalog overview for more information on the role and administration of location catalogs.
The geospatial information associated with assessments is specified in the definition of the workflow in which the assessment is completed. Assessments typically apply to large scale areas, such as operation areas, operating zones or forecast areas and these location associations are fairly static and do not change on a daily bases. Observations, on the other side, are associated with smaller scale locations, such as avalanche paths, ski runs or weather sites, and the location of every observation is different. To support this more dynamic relationship, all observation entry forms have a mandatory dropdown text field that allows users to associate one or many locations from your location catalog to your observation. Depending on the observation type, the list of available locations is restricted to ensure meaningful associations.
It is this location information that is used in the InfoEx report to show where observations were taken and what areas assessment apply to. While the name or abbreviation of the location is used in the tabular report of the InfoEx, the outline or the central point of the location is used in the map view.
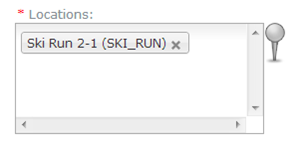
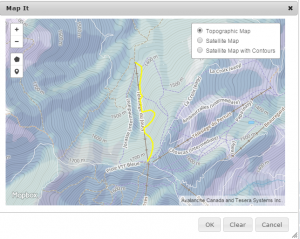
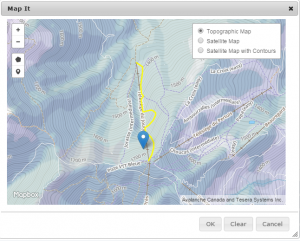
While these general location associations are sufficient for observations like field observations or avalanche summaries, a more precise description of the location for avalanche observations and snowpack observations can offer valuable additional information for the interpretation of this information. To support this need, the InfoEx application allows users to 'drop a pin' on a Google Earth map to indicate the exact location of the observation.
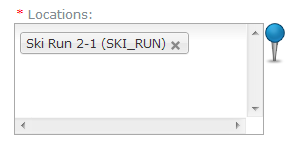
Observation that have a precise location are shown at this exactly location in the map view of the InfoEx. In the tabular view, the name of the associated location has a little blue pin next to it to indicate that we have precise location information for this observation.
Step-by-step description
Related documents
[1] Click to watch a help video
[2] Click to watch a help video
Functionality tested by
- Dec. 23: Pascal Haegeli


