Saving a report as an InfoEx report template
| REQUIREMENTS | |
| Permission | Operation Administrators and higher |
| Connectivity | Online only |
This page describes how a customized report can be saved as a report template for future use.
Background
The InfoEx system allows users to fully customized InfoEx reports with respect to content (dates, locations, observation types, observation parameters, and observation characteristics) and layout (order of tables, grouping of observations, sorting of observations, report format).
The style of the resulting report can be saved as a template that can be used for future use. You need to be an Operation Administrator to be able to save report templates.
The resulting templates can be access directly via the REPORTS menu or the report workflow module to improve the efficiency of information visualization and interpretation.
Step-by-Step Description
| 1. | To create a new report template, start with one of the standard reports that contain all of the available InfoEx information (Standard-Today or Standard-Yesterday) and modify the content and layout as you wish. |
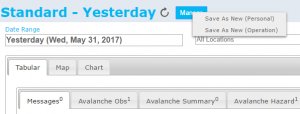
| 2. | To preserve the content and layout of the customized report for future use, click on the Manage button to the right of the name of the original report (Fig. 1) and select 'Save As New'. |
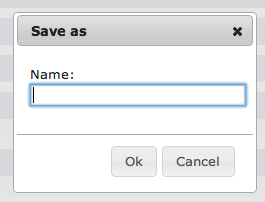
| 3. | Select a descriptive name for the new report template and click on Ok to save the template (Fig. 2). |
| 4. | The definition of the new report template has now been saved to the server and is immediately available under the REPORTS menu. You can also use the template through the report workflow module and subscribe to have it emailed to you as a PDF report. |
Related documents
Customizing reports
[1] Click to watch a help video
[2] Click to watch a help video
- Content
- Specifying the date or date range of an InfoEx report
- Restricting the locations included in an InfoEx report
- Specifying the tables to be included in an InfoEx report
- Adding or removing columns of individual tables in an InfoEx report
- Applying filters to individual tables in an InfoEx report
- Including or excluding proprietary information in an InfoEx report
- Layout
Managing report templates
- Saving a report as an InfoEx report template
- Modifying an existing InfoEx report template
- Deleting an existing InfoEx report template
- Signing up for the daily InfoEx report emails
Viewing report templates
Map Layers
- Operation overview
- Avalanche observations
- Avalanche hazard
- Snow Profiles
- Field summary
- Weather observations
- Time slider (used for all map layers)
- Additional external information sources
Charts
Functionality tested by
- Jan. 1, 2013: Pascal Haegeli

