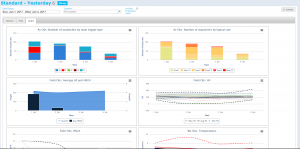
Viewing and downloading charts
Jump to navigation
Jump to search
| REQUIREMENTS | |
| Permission | All users |
| Connectivity | Online only |
This document describes the functionality of the Chart view of the InfoEx report.
The goal of the Chart view is to provide quick access to and a graphical view of summarized information. It also allows downloading of the chart to share the information.
Layout
The chart view displays a number of system defined charts. Whilst the charts that appear cannot be altered, the information they display can be user configured.
Functionality
- Click on the Operation overview checkbox in the layer hierarchy panel to show/hide this layer on the map.
- Click on the operation name in the layer hierarchy panel to directly zoom the map to its operation area.
- Click on the check box next to the operation name in the layer hierarchy panel to show/hide the outline of its operation area on the map.
- Click on the operation area of an operation on the map to view the operation name.
Related documents
- Operation overview
- Avalanche observations
- Avalanche hazard
- Snow Profiles
- Field summary
- Weather observations
- Time slider (used for all map layers)
- Additional external information sources
Functionality tested by
- Jan. 2, 2014: Pascal Haegeli
