Difference between revisions of "Restricting the locations included in an InfoEx report"
Jump to navigation
Jump to search
(→Step-by-step description) |
(→Step-by-step description) |
||
| Line 46: | Line 46: | ||
* Include as many forecast areas in your report as you like (Fig. 5). | * Include as many forecast areas in your report as you like (Fig. 5). | ||
* Click on {{ButtonGrey|Ok}} to submit your selection. | * Click on {{ButtonGrey|Ok}} to submit your selection. | ||
| − | {{Issue|The CAC forecast areas have not been imported into the system yet|IssueWithImage||}} | + | {{Issue|The CAC forecast areas have not been imported into the system yet.|IssueWithImage||}} |
|- | |- | ||
|class="StepNum" | | |class="StepNum" | | ||
| Line 60: | Line 60: | ||
|- | |- | ||
|class="StepNum" | 4. | |class="StepNum" | 4. | ||
| − | |Wait until the application as retrieved the data for the new date or date range from the server and displays it in the current view. | + | |[[File:ReportTabularViewLocationWithLocFilter.png|300px|thumb|right|Fig. 7: InfoEx report with location filter active.]]Wait until the application as retrieved the data for the new date or date range from the server and displays it in the current view. The locations included in your report are now listed in the Location field at the top of the InfoEx report (Fig. 7). |
|} | |} | ||
Revision as of 12:30, 28 October 2013
| REQUIREMENTS | |
| Permission | All user levels |
| Connectivity | Online only |
This document described how you can restrict the spatial extent of your InfoEx report by specifying what locations to include.
Background
The application offers four possibilities for restricting the locations included in an InfoEx report:
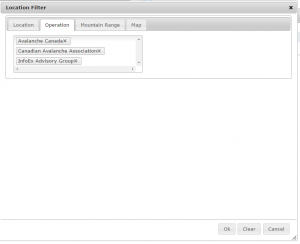
- Selecting the operations to be included
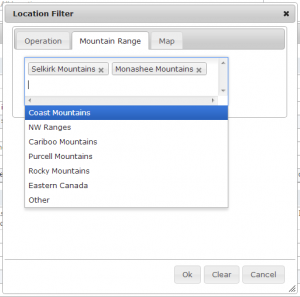
- Specifying the mountain ranges to be included
- Specifying the CAC forecast regions
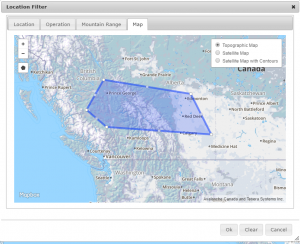
- Drawing a custom polygon
| NOTE | Please note that the four ways of specifying the locations are mutually exclusive and cannot be combined. In other words you cannot create a report that includes a number of operations and a mountain range. You can only create reports that either contain the observations of a number of operations or within an mountain range. |
Step-by-step description
| 1. | Click into the text box under the 'Location' label of the report view (Fig. 1). | ||
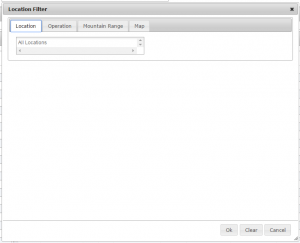
| 2. | This will open a popup window called 'Location Filter' with four tabs across the top (Fig. 2). | ||
| 3. | Use one of the following methods for specifying the locations you would like to be included in your report. | ||
By operations:
| |||
By mountain range:
| |||
File:ReportTabularViewLocationFilterForecastAreaFilled.png Fig. 5: Location filter popup window with forecast area selection
| |||
By custom polygon:
| |||
| 4. | Wait until the application as retrieved the data for the new date or date range from the server and displays it in the current view. The locations included in your report are now listed in the Location field at the top of the InfoEx report (Fig. 7). |
Related documents
- Link to relate document 1
- Link to relate document 2
Functionality tested by
- Date: Tester / Server / Application version (e.g., Oct. 23: Pascal Haegeli / QA Server / Test Version 0.28.00)


