Difference between revisions of "Map view layer: Operation overview"
Jump to navigation
Jump to search
(→Layout) |
|||
| Line 8: | Line 8: | ||
==Layout== | ==Layout== | ||
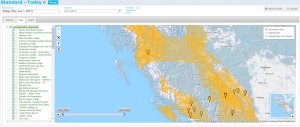
[[File:ReportMapLayersOverview.png|300px|thumb|right|Fig. 1: Operation overview layer of map view of InfoEx report.]] | [[File:ReportMapLayersOverview.png|300px|thumb|right|Fig. 1: Operation overview layer of map view of InfoEx report.]] | ||
| − | + | The '''Operation overview''' shows the [[Location types and symbology#OperationArea|Operation areas]] of all of the operations that contributed observations and assessment to the present InfoEx report as yellow outlines. | |
==Step-by-step description== | ==Step-by-step description== | ||
Revision as of 12:01, 2 January 2014
| REQUIREMENTS | |
| Permission | All users |
| Connectivity | Online only |
This document describes the functionality of the Operation overview layer of the Map view of the InfoEx report.
The goal of the Operation overview map layer is to provide user with quick access to summarized information from individual Infoex subscribers and context about where the observations in the current report are coming from.
Layout
The Operation overview shows the Operation areas of all of the operations that contributed observations and assessment to the present InfoEx report as yellow outlines.
Step-by-step description
| 1. | Description of first step. |
| 2. | Description of second step. |
| 3. | ... |
Related documents
- Operation overview
- Avalanche observations
- Avalanche hazard
- Snow Profiles
- Field summary
- Weather observations
- Time slider (used for all map layers)
- Additional external information sources
Functionality tested by
- Jan. 2, 2014: Pascal Haegeli
