Difference between revisions of "What's new 2013-14"
(→Version 3.14.X (April 1, 2014)) |
|||
| (3 intermediate revisions by the same user not shown) | |||
| Line 1: | Line 1: | ||
| − | This page lists the feature improvements for each of the releases of the InfoEx application. | + | This page lists the feature improvements for each of the releases of the InfoEx application during the 2013-14 season. |
| − | ==Version 3.14. | + | ==Version 3.14.3 (April 1, 2014)== |
This release of the InfoEx application includes the following improvements: | This release of the InfoEx application includes the following improvements: | ||
* '''Tabular view''' | * '''Tabular view''' | ||
| Line 14: | Line 14: | ||
** It is possible to resubmit the observations and assessments of a workflow if the submission fails. This should prevent the loss of observations in submissions from locations with questionable internet connectivity. | ** It is possible to resubmit the observations and assessments of a workflow if the submission fails. This should prevent the loss of observations in submissions from locations with questionable internet connectivity. | ||
** It is possible to set up distribution lists for sending out workflow summaries via your local email client before or after submission of your workflow. | ** It is possible to set up distribution lists for sending out workflow summaries via your local email client before or after submission of your workflow. | ||
| − | {{Note|We are currently still working out a last bug in this functionality | + | {{Note|We are currently still working out a last bug in this functionality, but we did not want to delay the release of the other improvements. As a consequence, the email functionality might currently not work on all computers.}} |
* '''Other''' | * '''Other''' | ||
** The External ID field in the location catalog is now visible to any user with operation administration privileges in operations that that use an external data system to submit to the InfoEx and therefore have an API key specified. This allows these operations to full manage their location catalog. | ** The External ID field in the location catalog is now visible to any user with operation administration privileges in operations that that use an external data system to submit to the InfoEx and therefore have an API key specified. This allows these operations to full manage their location catalog. | ||
| Line 275: | Line 275: | ||
==Version 3.0.0 (Dec. 1, 2013)== | ==Version 3.0.0 (Dec. 1, 2013)== | ||
This is the original release of the new InfoEx application. | This is the original release of the new InfoEx application. | ||
| + | |||
| + | [[Category: New 2013-14]] | ||
Latest revision as of 10:20, 5 November 2014
This page lists the feature improvements for each of the releases of the InfoEx application during the 2013-14 season.
Contents
- 1 Version 3.14.3 (April 1, 2014)
- 2 Version 3.13.2/3 (March 19, 2014)
- 3 Version 3.12.3 (March 11, 2014)
- 4 Version 3.12.2 (March 5, 2014)
- 5 Version 3.9.1 (Feb. 12, 2014)
- 6 Version 3.8.3 (Feb. 5, 2014)
- 7 Version 3.7.4 (Jan. 30, 2014)
- 8 Version 3.6.2 (Jan. 22, 2014)
- 9 Version 3.5.2 (Jan. 15, 2014)
- 10 Version 3.3.0 (Dec. 18, 2013)
- 11 Version 3.2.0 (Dec. 11, 2013)
- 12 Version 3.1.0 (Dec. 4, 2013)
- 13 Version 3.0.0 (Dec. 1, 2013)
Version 3.14.3 (April 1, 2014)
This release of the InfoEx application includes the following improvements:
- Tabular view
- Export of tabular report view to CSV file does now not include any Java Script code anymore.
- Location links in tabular view that get you straight to the specific observation in the map view work again.
- Chart view
- All charts display the date axis consistently.
- Collision control has been implemented in the chart view again.
| NOTE | Please note that chart locations and sizes stored in previous version are not compatible with the latest version and need to be set up again! |
- Bug in the integration of chart reports in workflows was fixed.
- Workflows
- It is possible to resubmit the observations and assessments of a workflow if the submission fails. This should prevent the loss of observations in submissions from locations with questionable internet connectivity.
- It is possible to set up distribution lists for sending out workflow summaries via your local email client before or after submission of your workflow.
| NOTE | We are currently still working out a last bug in this functionality, but we did not want to delay the release of the other improvements. As a consequence, the email functionality might currently not work on all computers. |
- Other
- The External ID field in the location catalog is now visible to any user with operation administration privileges in operations that that use an external data system to submit to the InfoEx and therefore have an API key specified. This allows these operations to full manage their location catalog.
- Observation entry screen load quicker when editing an existing observation.
Version 3.13.2/3 (March 19, 2014)
This release of the InfoEx application includes the following improvements:
- The chart view of the InfoEx report has been fixed and included in the application again. We currently support five charts:
- Av Obs: Number of avalanches by main trigger type
- Av Obs: Number of avalanches by size
- Field Obs: Average HS and HN24
- Field Obs: HS
- Field Obs: HN24
- Wx Obs: Temperatures
| NOTE | You need to have an internet connection to view that charts as the data for the charts is directly retrieved from the server. This direct connection allows you to chart large amounts of data more quickly. For example, you can easily create charts that show the data for the entire season (select 'season to date' in date range field when you are on the chart tab), while it is not possible to display this data in the tabular view. |
- The templates for customized reports have been expanded to also store the following information:
- Default tab of the report (tabular, map or chart)
- Selected layers in the map view
- Point of view of the map view
- Size of charts
- Position of charts
- This enhancement allows to create a wider array of customized reports that give you more efficient access to InfoEx data.
- Added three additional map layers that show snow height observations from field summaries:
- HN24 (<30cm: white label; 30-50cm: yellow label; >50cm: orange label)
- HST
- HS
Version 3.12.3 (March 11, 2014)
This release of the InfoEx application includes the following improvements:
- It is now possible to search by email address when adding a new user to your operation
- An additional ASARC folder has been added to the map view. This folder includes a new layer called 'Potential SH Size', which shows modelled crystal size of surface hoar at flat sheltered sites as a time series for the entire season. See http://webapps2.ucalgary.ca/~asarc/infoex for more information.
Version 3.12.2 (March 5, 2014)
This release of the InfoEx application includes the following bug fixes and improvements:
New features
Map view
- We made the following modifications to the map view of the InfoEx report:
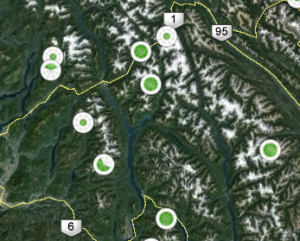
- Added a layer for each avalanche problem that shows the aspect-elevation rose diagram (Fig. 1). Note that it is best to look at these layers one at a time! Clicking on an individual avalanche problem icon opens
- Added a snowpack observation layer that shows the location of all snowpack observation. Clicking on the icon opens a pop-up balloon that provides the full background information on the avalanche problem.
- The weather layer with the temperatures has been reworked to always show the max temp in red in the top right corner and the min temp in blue in the bottom right corner. Temperatures above freezing are highlighted in yellow. Clicking on a weather site opens a pop-up balloon that contains the complete record of the given weather observation.
- Added an avalanche hazard layer that shows the latest hazard ratings of a given day in the shape of a hazard mountain (Fig. 3). Clicking on the hazard mountain opens a pop-up balloon that provides the full background information on the ratings.
- The previous operation overview layer with the annoying pop-ups was replaced by an optional background layer that shows the operation areas of all active InfoEx subscribers.
- A layer showing all public forecast regions has been added under the ARFI Layers folder.
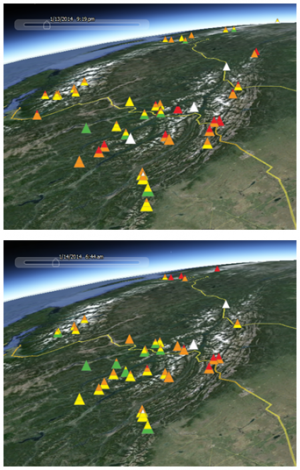
- It is now possible to more easily visualize changes over time in the map view of the InfoEx report using the Time Slider UI from Google Earth (Fig. 2). The slider allows you to easily step through any of the shown data in time (Fig. 3). Complete the following steps to visualize the change in avalanche activity and hazard ratings for a time period:
- Create a InfoEx report with the time period of interest
- Click on the map tab to start the Google Earth map
- Select the avalanche observation and avalanche hazard layers from the list of available layers
- Use the time slider to navigate through time.
| NOTE | It takes a little bit of time to familiarize yourself with the functionality of the slider, but it is very intuitive once and works quite slick once you have played around with it for a while. |
Tabular reports
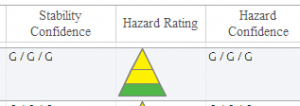
- We created a visual representation of the hazard ratings in the shape of a mountain with the three elevation bands as a new representation of hazard ratings in the avalanche hazard table of the InfoEx report (Fig. 4). Click on the different elevation bands to get detailed background information on the hazard rating. To change the column back to the old text format, click on the column header and choose 'Show/Hide Graphic'. Save your report template to save your setting permanently.
- We have included the following new columns into the InfoEx report that contain concatenated information. This makes the InfoEx report more concise and easier to read. The following list describes the patterns used for the concatenation
- Avalanche observations
- Age Range: <AgeRangeFrom>-<AgeRangeTo>
- Size: <SizeTyp>-<SizeMax> (single value if typ and max values are the same)
- Incl: <InclineMin>-(<InclineAvg>)-<InclineMax>
- Asp: <AspectFrom>-<AspectTo>
- Elev: <ElevationMin>-<ElevationMax>
- Depth: <DepthMin>-(<DepthAvg>)-<DepthMax>
- Width: <WidthMin>-<WidthMax>
- Length <LengthMin>-<LengthMax>
- Bed Surface: <BSLevel>:<BSCrystalForm>(<BSSizeMin>-<BSSizeMax>)
- Failure Plane: <FPCrystalForm>(<FPSizeMin>-<FPSizeMax>)
- Field observations
- Elev: <ElevationMin>-<ElevationMax>
- Temp: <TempLow>-<TempHigh>
- Sky: <SkyAM>-<SkyPM>
- PRTI: <PRTIAM>-<PRTIPM>
- Wind: <WindSpdAM>@<WindDirAM>-<WindSpdPM>@<WindDirPM>
- Xport: <XportAM>@<XportDirAM>-<XportPM>@<XportDirPM>
- Surface Forms: <CrystalFormAM>(<SizeMinAM>-<SizeMaxAM>)-<CrystalFormPM>(<SizeMinPM>-<SizeMaxPM>)
- Avalanche observations
- Note that single missing AM or PM value is shown as NA. The cell is completely empty if both the AM and PM values are missing. If the AM and PM values are the same, only a single value is shown.
- Weather observations
- Surface Forms: <CrystalForm1>(<SizeMin1>-<SizeMax1>),<CrystalForm2>(<SizeMin2>-<SizeMax2>)
- Wind <WindSpdCat>@<WindDirCat> or <WindSpdNum><WindSpdUnit>@[<WindDirCat> or <WindDirNum>]
| NOTE | While the standard InfoEx reports (Standard-Today and Standard-Yesterday) have been updated with the new columns, your operational InfoEx report templates will not have the new columns automatically included. See Adding or removing columns of individual tables in an InfoEx report for information on how to add/remove columns from reports. Instead of adjusting your existing template, it might actually be easier to start from the standard reports and recreate your template. Don't forget to save your report templates after you have made your changes! |
- The tabular InfoEx report can now be grouped by date in addition to mountain range (default) and operation. This is particularly useful to organize multi-day reports. Even though the report tables currently do not support multi-column sorting (e.g., date first and operation second), the grouping functionality allows you to do a pseudo multi-sorting.
- We have change the font to something more legible and it is now possible to specify the font size for the content of the InfoEx report in the layout settings.
Other
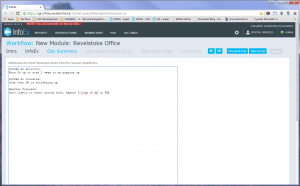
- We created a new Free Form Workflow Module that allows to seemlessly integrate additional operational information into your workflows that is not shared within the InfoEx community (Fig. 5). Examples include internal observation summaries or notes, operation plans, inventories or personal reflections. See Free form module for more details.
- Checks have been implemented to warn users about report queries that might take longer or are too big for the browser to handle (e.g., all of InfoEx for an entire season).
Improvements
- Increase the size of the location filter window to make it easier to specify a custom polygon in the Google Earth map interface.
- Locations are sorted alphabetically in all location pickers.
- Trailing spaces and line breaks are removed from all comment fields to eliminate the waste of space in report.
- The content of the map view is updated whenever a new filter is applied or removed in the tabular view of the InfoEx report.
- Grain sizes can now only be entered if a grain form has been specified.
Bug fixes
- Existing mountain range selection in location filter initializes properly.
- The values in the maximum fields (e.g., width max and depth max in avalanche observations) that are included in the favourite section of observation entry forms are properly written to the database and not dropped anymore.
- The dropdown list for the the bed surface crystal type now contains the full list of crystal types.
- The format of the InfoEx report is now initialized properly in the layout setting pop-up window.
- Numerous additional bug fixes
Version 3.9.1 (Feb. 12, 2014)
This release of the InfoEx application includes the following bug fixes and improvements:
New features
- We changed the format of the avalanche problem information in the avalanche hazard table in the following fashion to make this column more useful and have the avalanche hazard table be a good starting point for reading the InfoEx:
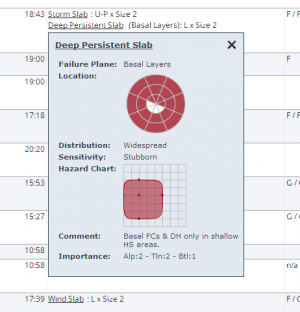
- For each avalanche problem, we added the typical values for likelihood of triggering and typical size (centre point of blob on hazard chart) to the text to provide more detailed information directly in the table (Fig. 1). The new format for avalanche problem information is:<Avalanche Character> (<Operation PWL>): <Typical Likelihood> x <Typical Size>
- We turned the avalanche problem label itself into a hyperlink. Clicking on this hyperlink opens a pop-up window that contains all of the detailed information about this avalanche problem. This is the same information that is shown in the avalanche problem table.
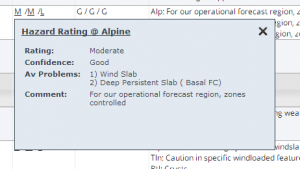
- We added similar hyperlinks for the each of the hazard ratings in the avalanche hazard table. Clicking on these hyperlinks opens a pop-up window that shows all of the available background information for the particular rating (Fig. 2). This information includes the relevant avalanche problems and their order of importance. This information has previously not been available in any InfoEx table.
- The following features have been added to the InfoEx tables to better highlight sorting and filtering:
- An arrow symbol has been added to the headers of the InfoEx report tables to indicate the sorting column.
- Filter symbols have been added to the headers of the InfoEx report tables to mark columns that have filters applied.
- We added a sentence at the top of tables with filters to highlight how many observations are hidden by the current filter(s).
- We made it easier to access the location of observations on the map by turning their location labels in the tabular view into hyperlinks. Clicking one of these hyperlinks opens the map view and zooms straight to the location of the observation. Click on the little blue pin to be moved directly to the precise location of the avalanche if a pins has been dropped.
| NOTE | The Google Earth map interface takes a little while to load when you click on such a hyperlink or the map tab for the first time. However, once the map interface has been loaded for the first time, you can quickly switch back and forth between the tabular view and the map view until you load another report template. |
| ISSUE | The data shown in the map currently does not update when you change the filtering on the tabular report. The map includes whatever data that was in the tabular view of the report when the map was loaded for the first time for a given report template. The content of the map view is only updated when you load a different report template from the report menu. A fix for this issue has been scheduled for one of the next releases. JIRA: -1343 (Feb. 11. 2013) |
Improvements
- The fields 'age range from' and 'age range to' have been concatenated in the InfoEx report into a single field called 'Age Range' to provide a more concise presentation of this information.
| NOTE | Please note that you might have to reformat your report templates if they included the old fields 'age range from' and 'age range to'. |
- The comment field for PWLs in the snowpack module was reduced in size in the Snowpack workflow module.
- We added '18' and 'Other' as additional options for the interval field in weather observations
- The avalanche observation pop-ups in the map view of the InfoEx now have operation and location at the top of the list of parameters.
- Te blue shading of the reference location in the 'drop-a-pin' Google Earth window for avalanche and snowpack observations has been removed.
- Default 'No Avalanche Problems' entire in the avalanche problem column of the avalanche hazard table has been removed.
Bug fixes
- Fixed validation rules of valley fog in field operations
- The clone/copy functionality for observations is working again for observation entry from within workflows.
- The reference date of workflows used in the drop down list when looking at historic workflows has been changed from the submission date to the date that was specified in the first step of the workflow. This is consistent with the date and time included in InfoEx reports and allows users to complete and retrieve workflows for past dates.
Version 3.8.3 (Feb. 5, 2014)
This release of the InfoEx application includes the following bug fixes and improvements:
- We have implemented standard colors for avalanche problems and the color picker in the avalanche hazard workflow module has been disabled. We used the following color scheme:
| Deep persistent slab | Persistent slab | Storm slab | Wind slab | Cornice | Wet slab | Loose wet avalanche | Loose dry avalanche | Unknown |
| NOTE | Please note that we have decoupled the custom color choices for the persistent weak layers (PWLs) from the colors for the avalanche problems. We currently do not use the PWL color for anything in the application, but we kept the color picker functionality for future uses (e.g., plotting of PWL depth and status over time) |
- Changed the label for avalanche problems to proper language.
- Colored the labels of the avalanche problems below the hazard charts in the second screen of the hazard assessment module.
- Added the ability for operation administrators to download the content of an InfoEx report that only contains data from your own operation (i.e., location filter only contains your operation) as csv files. Please note that you need to allow the browser to download multiple files at the same time since each table is downloaded in its own csv file.
| NOTE | This give you full flexibility to visualize your own InfoEx data in any way you like using programs like Excel. |
- Updated the avalanche observation import from CAAML files to include the missing fields (length min, length max, width max, observation time from).
- Changed the loading procedure for the workflow menu to avoid the delay experienced by operations with large location catalogs.
- Fixed the bug in the workflow report module to ensure that InfoEx reports with location filters show up properly in workflows.
Version 3.7.4 (Jan. 30, 2014)
This release of the InfoEx application includes the following bug fixes and improvements:
- InfoEx reports should load significantly faster as we further optimized (moved location filter from client to database, compression of data files). You should see the most dramatic improvements on multi-day reports and reports that do not include all of the subscribers.
- Expanded the height of the tables in tabular view of the InfoEx report to make better use of the screen real estate. The tables are now sized in a way what allows you to scroll through them with having the labels of the table header always at the top.
| NOTE | Reports will be shown the fastest if you choose the tabular view See Single page view versus individual tabs for tables for information on how to change the format of your report. |
- Changed the definition of the InfoEx 'Standard-Today' and 'Standard-Yesterday' from single page to tab format to take advantage of the better performance of this format.
- Submissions from the hazard comment module now also have a time in the InfoEx report
- The date and time associated with a workflow submission has been changed from the date and time of submission to the assessment date and time specified in the context step at the beginning of the workflow. This allows users to manually specify these values.
- Fixed issues related to the submission of attachments
Version 3.6.2 (Jan. 22, 2014)
This release of the InfoEx application includes the following bug fixes and improvements:
- InfoEx reports should load significantly faster as the hazard charts and aspect-elevation rose diagrams are now being created on the server and not on the client anymore.
- The observation entry forms in workflow have been changed to pop-up windows. This prevents users from accidentally moving on in the workflow (forward or backward arrow) without saving the observation locally first.
- The IU of workflow administration has been updated with a few layout improvements to make it more obvious how to add a new step to a workflow.
- The step label of the hazard assessment module now clearly highlights that there are two screens included in this workflow step.
Version 3.5.2 (Jan. 15, 2014)
This release of the InfoEx application includes the following bug fixes and improvements:
Location catalog
- To improve the navigation within the location catalog, the locations are now sorted by location type first and location name second. If a location has children, the same sorting scheme is applied to the child locations. The order of the locations types is:
- Forecast Region
- Operating Zone
- Permanent Closure
- Road
- Rail line
- Route
- Ski Run
- Av Path
- Wx Site
| NOTE | Note that the sorting is not instant when you add a new location or move an existing location. The sorting order is updated when you load the location tree the next time. |
- The mountain range polygons have been adjusted to ensure that all typical locations in western Canada are associated with the proper mountain ranges for the InfoEx report.
- A mountain range button was added to the editing mode in the location catalog. This allows you to see the boundaries of the mountain range polygons used for the InfoEx reports when editing your locations.
Workflows
- The workflow navigation issues that got you stuck at the avalanche problem page after using the step labels for navigation have been resolved. You can now use the arrows and labels alternatively to reliably move back and forth within a workflow.
- The interface for managing workflows now enforces a number restrictions for workflow designs
- The context module have been removed from the drop down list of available modules. Instead, a context step is automatically added to the beginning of any workflow that includes any steps with data submission (observations, snowpack, hazard assessment, hazard comment).
- You can only add a single snowpack step to a workflow.
- You can only add either a hazard assessment or a hazard comment step to a workflow, but not both.
- You can add as many report, observation and webpage steps as you like.
| NOTE | Even though we strongly encourage subscribers to adjust their existing workflows to adhere to these restrictions, we do not enforce them. In other words, existing workflow that do not comply with these restrictions are still valid and can be executed. The restrictions are only enforced when you create a new workflows. |
- Settings for hazard assessment module now populated properly
- The labels for likelihood of triggering on the y-axis of the hazard chart have been fixed to be consistent with AvalX.
InfoEx Reports
- The user interface for reports has been improved with the following features:
- The list of available reports has been moved to the report menu. This is more consistent with the other menu buttons and allows you to directly access the report you want to look at without having to load the 'CAA and CAC Messages' report first.
- The reports are listed in alphabetical order and the system reports (CAA and CAC Messages, Standard-Today, Standard-Yesterday) have been separated from the customized reports.
- A refresh button has been added right of the title of the report to make it more convenient to refresh the current report with the latest data.
- The management of reports (save, overwrite, delete) has been moved into a Manage button. This button is only visable to users with Operation Administrator privileges
- The button for specifying the layout of a report (tables, table order, grouping, single page versus tabs) is now labelled Layout
Tabular reports
- The filtering by operation on individual tables has been disabled. If you want to limit your InfoEx report to a number of operations, we recommend that you do this through the location field at the top of the report. This location filter applies to all tables in your InfoEx report.
- All zero values (0) entered in numerical fields in observation entry forms are now properly showing up in the InfoEx report.
- The aspect rose is now working properly in the tab view of the tabular InfoEx report.
Map view
- The issue that any observation with an attachment had its associated location doubled is now fixed.
- Avalanche observations with a dropped pin are now showing up at the right location in the map view of the InfoEx report
- Avalanche observations that are associated with multiple locations from the location catalog are now properly plotted in the map view of the InfoEx report at the combined centroid of the associated locations.
- We added two addition layers to the AFRI section of the map view of the InfoEx report. They point at station data from the government of Alberta.
PDF report
- The single column sorting of the InfoEx report is now also implemented in the PDF reports. So any sort order specified in the reports templates (e.g., by operation) is now also used in the PDF reports.
- The hazard charts are now properly represented in the PDF reports with the correct values for the typical values of likelihood and destructive size
- If a location does not have an abbreviation defined, we no use the full name just like in the tabular report. As a consequence, there should not be any null locations in the PDF report any more.
Version 3.3.0 (Dec. 18, 2013)
This release of the InfoEx application includes the following bug fixes and improvements:
- Fixed issue with point locations showing up multiple times after editing locations
- Fixed issue with observations disappearing in the observation overview table after cancelling editing an observation
- Observations associated with location that cover multiple mountain ranges now properly show up in reports that use mountain ranges for the location filter
- The system now provides users with a system message when locations are loaded for editing
- Users are now notified that PWLs with associated observations and/or assessments cannot be deleted from the system
- InfoEx reports are now ordered alphabetically in dropdown list
- Operations in the dropdown list after the login screen (only visible when associated with more than two operations) are now ordered alphabetically.
- The dropdown list in the find functionality of the location catalog now shows all locations that match the search text
- The PDF version of the InfoEx was updated with the new 1-800 number for emergency help
Version 3.2.0 (Dec. 11, 2013)
This release of the InfoEx application includes the following improvements:
- Changed default value for interval in wx obs from 6 to 12
- Updated sort order of avalanche problems, avalanche hazard, snowpack description and PWL in standard InfoEx reports for be properly sorted by operation (FYI: You need to fix this yourself in any customized reports)
- Fixed timing issue with InfoEx report not being displayed properly
- Attachments are now accessible through pop-up balloons in map view of Infoex report
- Updated RWIS layer in map view now includes the locations of all available sites
- Added 'U' (unknown) as an additional trigger type for avalanche observations (currently not accessible in client) and allow avalanche observations without a trigger to be submitted by the CAAML API
- resolved issue related to deleting an adding users with same email address
- Fixed numerous issues in the back end of the system.
Version 3.1.0 (Dec. 4, 2013)
This release of the InfoEx application includes the following improvements:
- Attachments added to observations within workflows are now properly uploaded to the server.
- The text of comments fields in most observation types is now wrapped in the InfoEx report making it easier to ready the entire content.
- It is now mandatory to associate a location to any workflow that includes data submission (i.e., included the snowpack, hazard assessment or hazard comment module).
- The issue with the missing avalanche icons in the map view has been resolved.
- The map view of the InfoEx report is loading much quicker.
- The issues with the email delivery of the PDF InfoEx reports have been resolved.
Version 3.0.0 (Dec. 1, 2013)
This is the original release of the new InfoEx application.
