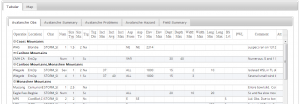
Single page view versus individual tabs for tables
Jump to navigation
Jump to search
| REQUIREMENTS | |
| Permission | All user levels |
| Connectivity | Online only |
This page describes basic layout options for the presentation of report information.
Background
Reports can be presented to viewers two ways.
The following information assumes you are logged in to the InfoEx application, you have selected an operation (if you have more than one valid operation) and you have selected 'Reports' on the main application menu.
Step-by-step-description
| 1. | To access the grouping options click on the Layout button in the upper right corner of the 'Reports' page (Fig. 1). |
| 2. | A dropdown box will appear offering selections for the layout, grouping, font size and table types for the report that will be produced (Fig.2). |
| 3. | Under 'Layout' select the layout format of your choice. The available layout options are:
|
| 4. | Click on the Okay button at the bottom of the layout pop-up window to commit your preferences to the system. |
| 5. | Wait while the application retrieves the data for the new grouping format from the server and displays it in the current view. |
Related documents
Customizing reports
[1] Click to watch a help video
[2] Click to watch a help video
- Content
- Specifying the date or date range of an InfoEx report
- Restricting the locations included in an InfoEx report
- Specifying the tables to be included in an InfoEx report
- Adding or removing columns of individual tables in an InfoEx report
- Applying filters to individual tables in an InfoEx report
- Including or excluding proprietary information in an InfoEx report
- Layout
Managing report templates
- Saving a report as an InfoEx report template
- Modifying an existing InfoEx report template
- Deleting an existing InfoEx report template
- Signing up for the daily InfoEx report emails
Viewing report templates
Map Layers
- Operation overview
- Avalanche observations
- Avalanche hazard
- Snow Profiles
- Field summary
- Weather observations
- Time slider (used for all map layers)
- Additional external information sources
Charts
Functionality tested by
- Jan. 1, 2014: Pascal Haegeli


