Difference between revisions of "Map view layer: Operation overview"
Jump to navigation
Jump to search
(→Functionality) |
|||
| (5 intermediate revisions by the same user not shown) | |||
| Line 4: | Line 4: | ||
This document describes the functionality of the '''Operation overview''' layer of the '''Map view''' of the InfoEx report. | This document describes the functionality of the '''Operation overview''' layer of the '''Map view''' of the InfoEx report. | ||
| − | The goal of the '''Operation overview''' map layer is to provide | + | The goal of the '''Operation overview''' map layer is to provide quick access to summarized information from individual Infoex subscribers and context about where the observations in the current report are coming from. |
==Layout== | ==Layout== | ||
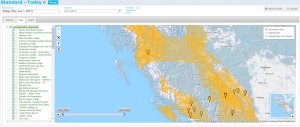
[[File:ReportMapLayersOverview.png|300px|thumb|right|Fig. 1: Operation overview layer of map view of InfoEx report.]] | [[File:ReportMapLayersOverview.png|300px|thumb|right|Fig. 1: Operation overview layer of map view of InfoEx report.]] | ||
| − | + | The operation overview map layer shows the [[Location types and symbology#OperationArea|operation areas]] of all of the currently active operations in InfoEx (Fig. 1). | |
| − | The operation overview map layer shows the [[Location types and symbology#OperationArea|operation areas]] of all of the operations | ||
| − | All of the | + | All of the operations are listed under the '''Operation overview''' label in the layer hierarchy panel left of the map (Fig. 1). |
==Functionality== | ==Functionality== | ||
| − | * Click on the Operation overview | + | * Click on the Operation overview checkbox in the layer hierarchy panel to show/hide this layer on the map. |
| − | * Click on the operation name in the layer hierarchy panel to directly zoom the map to its [[Location types and symbology#OperationArea|operation area]] | + | * Click on the operation name in the layer hierarchy panel to directly zoom the map to its [[Location types and symbology#OperationArea|operation area]]. |
* Click on the check box next to the operation name in the layer hierarchy panel to show/hide the outline of its [[Location types and symbology#OperationArea|operation area]] on the map. | * Click on the check box next to the operation name in the layer hierarchy panel to show/hide the outline of its [[Location types and symbology#OperationArea|operation area]] on the map. | ||
| − | * Click on the [[Location types and symbology#OperationArea|operation area]] of an operation on the map to view the | + | * Click on the [[Location types and symbology#OperationArea|operation area]] of an operation on the map to view the operation name. |
| − | |||
| − | |||
| − | |||
| − | |||
| − | |||
| − | |||
| − | |||
| − | |||
| − | |||
| − | |||
| − | |||
| − | |||
| − | |||
| − | |||
| − | |||
| − | |||
| − | |||
| − | |||
| − | |||
| − | |||
| − | |||
| − | |||
| − | |||
| − | |||
| − | |||
| − | |||
| − | |||
| − | |||
| − | |||
| − | |||
| − | |||
| − | |||
| − | |||
| − | |||
| − | |||
| − | |||
| − | |||
==Related documents== | ==Related documents== | ||
Latest revision as of 10:23, 1 June 2017
| REQUIREMENTS | |
| Permission | All users |
| Connectivity | Online only |
This document describes the functionality of the Operation overview layer of the Map view of the InfoEx report.
The goal of the Operation overview map layer is to provide quick access to summarized information from individual Infoex subscribers and context about where the observations in the current report are coming from.
Layout
The operation overview map layer shows the operation areas of all of the currently active operations in InfoEx (Fig. 1).
All of the operations are listed under the Operation overview label in the layer hierarchy panel left of the map (Fig. 1).
Functionality
- Click on the Operation overview checkbox in the layer hierarchy panel to show/hide this layer on the map.
- Click on the operation name in the layer hierarchy panel to directly zoom the map to its operation area.
- Click on the check box next to the operation name in the layer hierarchy panel to show/hide the outline of its operation area on the map.
- Click on the operation area of an operation on the map to view the operation name.
Related documents
- Operation overview
- Avalanche observations
- Avalanche hazard
- Snow Profiles
- Field summary
- Weather observations
- Time slider (used for all map layers)
- Additional external information sources
Functionality tested by
- Jan. 2, 2014: Pascal Haegeli
