Map view layer: Avalanche hazard
Jump to navigation
Jump to search
| REQUIREMENTS | |
| Permission | All users |
| Connectivity | Online only |
This document describes the functionality of the Avalanche Hazard layer of the Map view of the InfoEx report.
The goal of the Avalanche Hazard map layer is to provide a spatial overview of all the hazard assessments submitted in the time period of the current report.
Layout
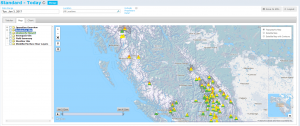
The hazard assessment map layer shows the locations of all the hazard assessments included in the current report (Fig. 1). They are displayed at the centre point of the location associated with the hazard assessment.
The icons of the hazard assessments are shown for each rating submitted by elevation band Alpine/Treeline/Below Treeline. The color for each band represents the rating:
- 1 - Green
- 2 - Yellow
- 3 - Orange
- 4 - Red
- 5 - Black
The currently supported weather parameters are (Fig. 2):
| Tmin | Blue label | Lowest minimum temperature recorded at weather sites by this operation during the time period of report. |
| Tmax | Red label | Highest maximum temperature recorded at weather sites by this operation during the time period of report. |
| WX Label | White label | Name and elevation of weather site. |
Functionality
- Click on the Avalanche Hazard checkbox in the layer hierarchy panel to show/hide this layer on the map.
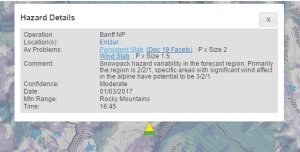
- Click on the icon of an individual hazard assessment to view its details in a pop-up window (Fig. 2). The pop-up window contains all of the information that was submitted for the observation including links to Avalanche Problem and PWL details if they were included.
Related documents
- Operation overview
- Avalanche observations
- Avalanche hazard
- Snow Profiles
- Field summary
- Weather observations
- Time slider (used for all map layers)
- Additional external information sources
Functionality tested by
- Jan. 2, 2014: Pascal Haegeli

