| REQUIREMENTS |
| Permission |
All users |
| Connectivity |
Online only |
This document describes the functionality of the Weather Obs layer of the Map view of the InfoEx report.
The goal of the Weather Obs map layer is to provide users with a spatial overview of all the weather observations submitted to the InfoEx in the time period of the current report.
Layout

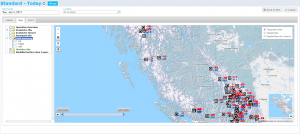
Fig. 1: Weather obs layers of map view of InfoEx report.

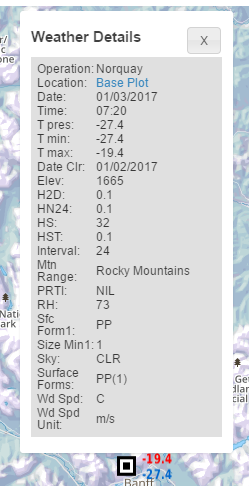
Fig. 2: Detail of weather observation shown in map view of InfoEx report.
The weather obs map layer shows the point locations of all the weather observations included in the current report (Fig. 1).
The temperatures beside the weather obs icon represent (Fig. 2):
| Tmin
|
Blue label
|
Minimum temperature recorded at this weather site for this observation.
|
| Tmax
|
Red label
|
Maximum temperature recorded at this weather site for this observation.
|
| NOTE |
Temperatures above 0C are displayed using an orange font. |
| NOTE |
If there is more than one observation for a site for the selected time period then the max and min temperatures will be displayed on top of each other making them unreadable. Click on the icon to display the multiple observations separately. |
Functionality
- Click on the Weather Obs checkbox in the layer hierarchy panel to show/hide this layer on the map.
- Click on the Weather Obs heading in the layer hierarchy panel to directly zoom the map to the area that has weather obs.
Related documents
Functionality tested by
- Jan. 2, 2014: Pascal Haegeli

