Difference between revisions of "Viewing and downloading charts"
Jump to navigation
Jump to search
(Created page with "__NOTOC__ {{Requirements|UserLevel=All users|Connectivity=Online only}} This document describes the functionality of the '''Chart view''' of the InfoEx report. The goal of t...") |
(→Related documents) |
||
| (9 intermediate revisions by the same user not shown) | |||
| Line 4: | Line 4: | ||
This document describes the functionality of the '''Chart view''' of the InfoEx report. | This document describes the functionality of the '''Chart view''' of the InfoEx report. | ||
| − | The goal of the '''Chart''' view is to provide quick access to and a graphical view of summarized information. It also allows downloading of the chart | + | The goal of the '''Chart''' view is to provide quick access to, and a graphical view of, summarized information. It also allows downloading of the chart and saving the chart view as a report template. |
==Layout== | ==Layout== | ||
| Line 11: | Line 11: | ||
==Functionality== | ==Functionality== | ||
| − | * | + | * Select the [[Specifying the date or date range of an InfoEx report|date range]], [[Restricting the locations included in an InfoEx report|locations]] and [[Specifying the tables to be included in an InfoEx report|data tables]] you need for the chart you are interested in. Not all charts will display sensible information without appropriate selection parameters. |
| − | * | + | * Some click on/off configurability is available for most charts in the bottom centre panel. |
| − | * | + | * Chart size can be altered by dragging the bottom corners. Charts can be re-ordered by clicking on their title and dragging and dropping. |
| − | * | + | * A zoom function is available by highlighting the section of the chart you want to view in more detail. A reset zoom button then appears to allow the chart zoom to be reset. |
| + | * Charts can be printed and downloaded from the menu in the top right corner of each chart. | ||
| + | * Chart views can be saved as a [[Saving a report as an InfoEx report template|report template]]. | ||
==Related documents== | ==Related documents== | ||
| − | + | * [[InfoEx report views]] | |
| + | |||
| + | ===Customizing reports=== | ||
| + | * [[Specifying the date or date range of an InfoEx report]] | ||
| + | * [[Restricting the locations included in an InfoEx report]] | ||
| + | * [[Specifying the tables to be included in an InfoEx report]] | ||
| + | |||
| + | ===Managing report templates=== | ||
| + | * [[Saving a report as an InfoEx report template]] | ||
| + | * [[Modifying an existing InfoEx report template]] | ||
| + | * [[Deleting an existing InfoEx report template]] | ||
==Functionality tested by== | ==Functionality tested by== | ||
Latest revision as of 10:24, 5 June 2017
| REQUIREMENTS | |
| Permission | All users |
| Connectivity | Online only |
This document describes the functionality of the Chart view of the InfoEx report.
The goal of the Chart view is to provide quick access to, and a graphical view of, summarized information. It also allows downloading of the chart and saving the chart view as a report template.
Layout
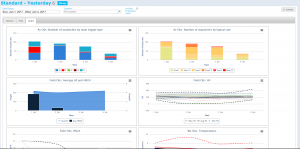
The chart view displays a number of system defined charts. Whilst the charts that appear cannot be altered, the information they display can be user configured.
Functionality
- Select the date range, locations and data tables you need for the chart you are interested in. Not all charts will display sensible information without appropriate selection parameters.
- Some click on/off configurability is available for most charts in the bottom centre panel.
- Chart size can be altered by dragging the bottom corners. Charts can be re-ordered by clicking on their title and dragging and dropping.
- A zoom function is available by highlighting the section of the chart you want to view in more detail. A reset zoom button then appears to allow the chart zoom to be reset.
- Charts can be printed and downloaded from the menu in the top right corner of each chart.
- Chart views can be saved as a report template.
Related documents
Customizing reports
- Specifying the date or date range of an InfoEx report
- Restricting the locations included in an InfoEx report
- Specifying the tables to be included in an InfoEx report
Managing report templates
- Saving a report as an InfoEx report template
- Modifying an existing InfoEx report template
- Deleting an existing InfoEx report template
Functionality tested by
- Jan. 2, 2014: Pascal Haegeli
