Difference between revisions of "Grouping of observations within tables"
Jump to navigation
Jump to search
(→Step-by-step-description) |
(→Step-by-step-description) |
||
| Line 18: | Line 18: | ||
|- | |- | ||
|class="StepNum" | 3. | |class="StepNum" | 3. | ||
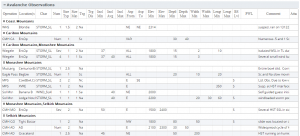
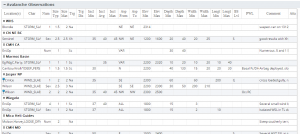
| − | |[[File:ReportGroupedbyRange.png|300px|thumb|right|Fig. 3:Example of | + | |[[File:ReportGroupedbyRange.png|300px|thumb|right|Fig. 3: Example of avalanche observations grouped by Range]] [[File:ReportGroupedbyOperation.png|300px|thumb|right|Fig. 4: Example of avalanche observations grouped by Operation]]Under 'Group By' select the grouping option of your choice. The grouping options will provide output as follows: |
* '''Range''' (default)<br/>This option groups the report entries in each table by the mountain range of the location (Fig. 3). The mountain ranges are ordered in a NW to SE direction modeled after the legacy InfoEx report. Different from the legacy InfoEx reports, observations that fall into multiple mountain ranges are not shown in multiple mountain range groups, but a new group for the particular combination of mountain ranges. This prevents the duplication of observations in the report. | * '''Range''' (default)<br/>This option groups the report entries in each table by the mountain range of the location (Fig. 3). The mountain ranges are ordered in a NW to SE direction modeled after the legacy InfoEx report. Different from the legacy InfoEx reports, observations that fall into multiple mountain ranges are not shown in multiple mountain range groups, but a new group for the particular combination of mountain ranges. This prevents the duplication of observations in the report. | ||
{{note|The mountain range of the location is decided automatically when the location is created or edited by comparing their geometry to a baseline map of predefined mountain ranges. If the location overlaps two defined mountain ranges it will be associated with both.|NoteWithImage}} | {{note|The mountain range of the location is decided automatically when the location is created or edited by comparing their geometry to a baseline map of predefined mountain ranges. If the location overlaps two defined mountain ranges it will be associated with both.|NoteWithImage}} | ||
Revision as of 16:44, 1 January 2014
| REQUIREMENTS | |
| Permission | All user levels |
| Connectivity | Online only |
This page describes how observations within a table may be grouped in InfoEx reports.
Background
Users can group the rows of tables according to three preferences: range; operation; and, no preference.
Step-by-step-description
| 1. | To access the grouping options click on the Layout button in the upper right corner of the 'Reports' page (Fig. 1). | ||||
| 2. | A dropdown box will appear offering selections for the layout, grouping, and table types for the report that will be produced (Fig.2). | ||||
| 3. | Under 'Group By' select the grouping option of your choice. The grouping options will provide output as follows:
| ||||
| 4. | Click on the Okay button at the bottom of the layout pop-up window to commit your preferences to the system. | ||||
| 5. | Wait while the application retrieves the data for the new grouping format from the server and displays it in the current view. |
Related documents
Customizing reports
[1] Click to watch a help video
[2] Click to watch a help video
- Content
- Specifying the date or date range of an InfoEx report
- Restricting the locations included in an InfoEx report
- Specifying the tables to be included in an InfoEx report
- Adding or removing columns of individual tables in an InfoEx report
- Applying filters to individual tables in an InfoEx report
- Including or excluding proprietary information in an InfoEx report
- Layout
Managing report templates
- Saving a report as an InfoEx report template
- Modifying an existing InfoEx report template
- Deleting an existing InfoEx report template
- Signing up for the daily InfoEx report emails
Viewing report templates
Map Layers
- Operation overview
- Avalanche observations
- Avalanche hazard
- Snow Profiles
- Field summary
- Weather observations
- Time slider (used for all map layers)
- Additional external information sources
Charts
Functionality tested by
- Jan. 1, 2014: Pascal Haegeli


