| REQUIREMENTS |
| Permission |
All user levels |
| Connectivity |
Online only |
This page describes how observations within a table may be grouped in InfoEx reports.
Background
Users can group the rows of tables according to three preferences: range; operation; and, no preference.
Step-by-step-description
| 1.
|
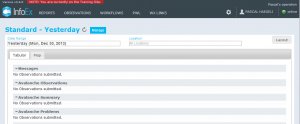
 Fig. 1: How to access the grouping options |
| 2.
|
 Fig. 2: Layout pop-up window for InfoEx reports |
| 3.
|
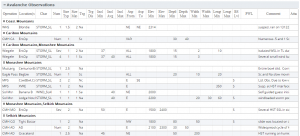
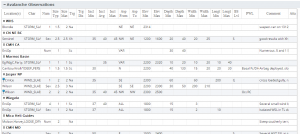
 Fig. 3: Example of avalanche observations grouped by Range  Fig. 4: Example of avalanche observations grouped by Operation - Range (default)
This option groups the report entries in each table by the mountain range of the location (Fig. 3). The mountain ranges are ordered in a NW to SE direction modeled after the legacy InfoEx report. Observations that fall into multiple mountain ranges are not shown in multiple mountain range groups, but a new group for the particular combination of mountain ranges. This prevents the duplication of observations in the report.
| NOTE |
The mountain range of the location is decided automatically when the location is created or edited by comparing their geometry to a baseline map of predefined mountain ranges. If the location overlaps two defined mountain ranges it will be associated with both. |
- Operation
This option groups the report entries in each table in pseudo geographic order that sorts the operation according to the three main InfoEx regions (1. Alaska, NW Region and Coast Mtns; 2. Columbia and Rocky Mtns; 3. Eastern Canada) and roughly sorts them from NW to SE (Fig. 4). This option is useful for smaller reports (e.g., nearest neighbours) as the mountain range is less important and it saves space by eliminating the operation column in the table.
- Date
This option groups the report entries in each table by date. This option is useful for reports spanning multiple days.
- None
Choosing this option eliminates the grouping within the individual tables. The entire tables are either sorted pseudo-geographically by operation (default) or by any custom sorting specified by the user.
|
| 4.
|
Click on the Okay button at the bottom of the layout pop-up window to commit your preferences to the system.
|
| 5.
|
Wait while the application retrieves the data for the new grouping format from the server and displays it in the current view.
|
Related documents
Customizing reports
[1] Click to watch a help video
[2] Click to watch a help video
Managing report templates
Viewing report templates
Map Layers
Charts
Functionality tested by
- Jan. 1, 2014: Pascal Haegeli


