Grouping of observations within tables
Jump to navigation
Jump to search
| REQUIREMENTS | |
| Permission | All user levels |
| Connectivity | Online only |
This page describes how observations within a table may be grouped in InfoEx reports.
Background
Users can group the rows of tables according to three preferences: range; operation; and, no preference.
Step-by-step-description
| 1. | To access the grouping options click on the Layout button in the upper right corner of the 'Reports' page (Fig. 1). | ||||||||||
| 2. | A dropdown box will appear offering selections for the layout, grouping, and table types for the report that will be produced (Fig.2). For a description of selecting tables and layout see: Specifying the tables to be included in an InfoEx report and Single page view versus individual tabs for tables. | ||||||||||
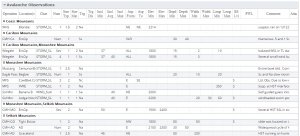
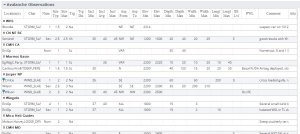
| 3. | Under 'Group By' select the grouping option that you prefer. The grouping options will provide output as follows:
|
Related documents
Customizing reports
[1] Click to watch a help video
[2] Click to watch a help video
- Content
- Specifying the date or date range of an InfoEx report
- Restricting the locations included in an InfoEx report
- Specifying the tables to be included in an InfoEx report
- Adding or removing columns of individual tables in an InfoEx report
- Applying filters to individual tables in an InfoEx report
- Including or excluding proprietary information in an InfoEx report
- Layout
Managing report templates
- Saving a report as an InfoEx report template
- Modifying an existing InfoEx report template
- Deleting an existing InfoEx report template
- Signing up for the daily InfoEx report emails
Viewing report templates
Map Layers
- Operation overview
- Avalanche observations
- Avalanche hazard
- Snow Profiles
- Field summary
- Weather observations
- Time slider (used for all map layers)
- Additional external information sources
Charts
Functionality tested by
- Jan. 1, 2014: Pascal Haegeli


