Difference between revisions of "Downloading your own data"
(→Step-by-step description) |
(→Step-by-step description) |
||
| Line 49: | Line 49: | ||
|You can use the following formula to get rid of the HTML/JavaScript code in a location column with a single location. If you a location value in cell B2, the formula is: | |You can use the following formula to get rid of the HTML/JavaScript code in a location column with a single location. If you a location value in cell B2, the formula is: | ||
<code>=RIGHT(LEFT(B2,LEN(B2)-5), LEN(B2)-78)</code> | <code>=RIGHT(LEFT(B2,LEN(B2)-5), LEN(B2)-78)</code> | ||
| + | |||
Use the above formula to calculate a new column of properly formatted locations. Copy the new column and paste its values into the the old location column. | Use the above formula to calculate a new column of properly formatted locations. Copy the new column and paste its values into the the old location column. | ||
{{Note|We are currently working on an export solution that does not include any JavaScript/HTML code}} | {{Note|We are currently working on an export solution that does not include any JavaScript/HTML code}} | ||
Revision as of 13:57, 25 March 2014
| REQUIREMENTS | |
| Permission | Operation Administrator and higher |
| Connectivity | Online only |
This pages describes how to download your own data from the InfoEx for use in programs like Excel.
Background
To allow operations to make better use of the data they have entered into the InfoEx, we included an export functionality in the application. The report tables are downloaded as individual CSV (commas delimited) files that can be read by programs like Excel or Numbers. These files can be used for local archiving, research projects and case studies or end of season reports.
| NOTE | It is only possible to download reports that only include data of your own operation. InfoEx data files that include multiple operations require permission from the each of the included subscribers and can only be must be requested from the Canadian Avalanche Association |
See Downloading your location catalog as a KML file for information on how to download you own location catalog.
Step-by-step description
| 1. | Start from one of the standard reports (Standard-Today or Standard-Yesterday). | ||
| 2. | Click on the location field above the tables and select your own operation in the operation tab of the location filter (see Restricting the locations included in an InfoEx report for more details.
| ||
| 3. | Adjust the report to your liking by
| ||
| 4. | Select the desired date range for your report by clicking on the date range field above the tables. Once you have selected the desired date range, wait for the data to appear.
| ||
| 5. | Click on the export button (Fig. 1) in the top right corner above the report tables. This button is only visible of your account has operation administrator privileges and your report only contains data from your own operation. | ||
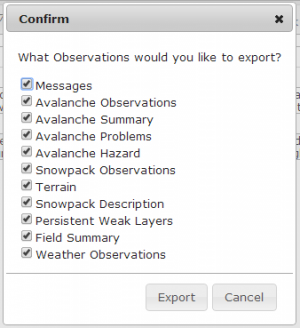
| 6. | Confirm the tables you would like to export (Fig. 2) and click on Export. | ||
| 7. | Confirm in the yellow bar at the top of the browser window (Fig. 3) that you allow the site to download multiple files. | ||
| 8. | Open the downloaded files in a program like Excel or Numbers. | ||
| 10. | You can use the following formula to get rid of the HTML/JavaScript code in a location column with a single location. If you a location value in cell B2, the formula is:
Use the above formula to calculate a new column of properly formatted locations. Copy the new column and paste its values into the the old location column.
|
Related documents
Customizing reports
[1] Click to watch a help video
[2] Click to watch a help video
- Content
- Specifying the date or date range of an InfoEx report
- Restricting the locations included in an InfoEx report
- Specifying the tables to be included in an InfoEx report
- Adding or removing columns of individual tables in an InfoEx report
- Applying filters to individual tables in an InfoEx report
- Including or excluding proprietary information in an InfoEx report
- Layout
Managing report templates
- Saving a report as an InfoEx report template
- Modifying an existing InfoEx report template
- Deleting an existing InfoEx report template
- Signing up for the daily InfoEx report emails
Viewing report templates
Map Layers
- Operation overview
- Avalanche observations
- Avalanche hazard
- Snow Profiles
- Field summary
- Weather observations
- Time slider (used for all map layers)
- Additional external information sources
Charts
Functionality tested by
- Feb 5, 2014: Pascal Haegeli

